Update:
To create your own visualization like this, check out my project Datamaps.When you walk into Bazaarvoice’s office in Austin, TX, you can’t miss a giant screen in the main lobby displaying some interesting metrics regarding our business.
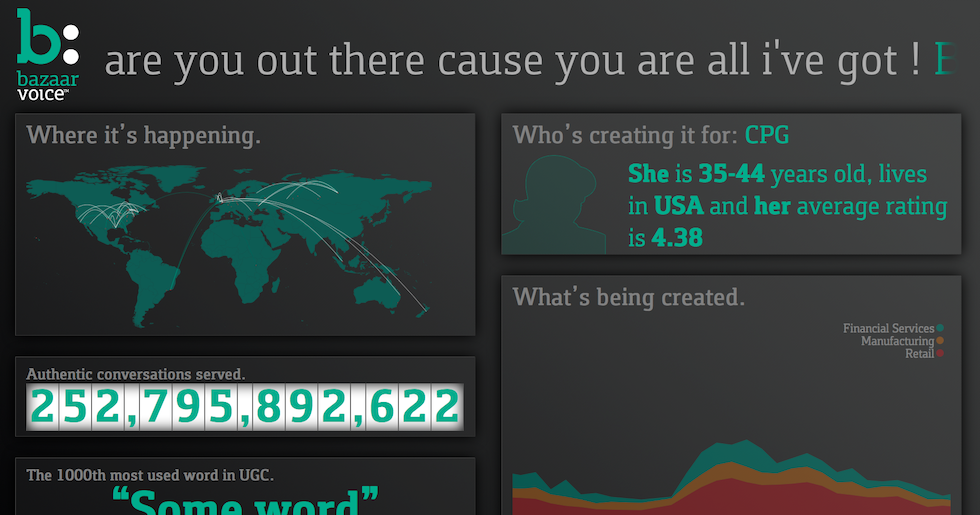
Part of that display is an SVG map of the world using D3.js (♥ d3.geo), and all day long we’re watching it connect the people that ask questions on our client’s sites to the people that answer them.
The visualization we made takes a series of data, including the time and geolocations of the questioners and answerers. I animate an arc connecting to connect the two points.
Drawing a world map in D3.js:
Grab the world data json data here
D3.js allows us to use pure latitude/longitude coordinates the entire time. From drawing the map to pinpointing the location of the users, we never have to figure out the X/Y coordinates on the map. Major win.